
The Industrial Internet of Things (IIoT) is a segment of Internet of Things (IoT) that’s often less visible than our common household objects such as cars, appliances, and central climate control that can be monitored and controlled by computers or smartphones. Dubbed the “fourth industrial revolution” or Industry 4.0, the IIoT is the digitization of industrial assets and processes that connects products, machines, services, locations/sites to workers, managers, suppliers, and partners.
In addition, the convergence of robotics, artificial intelligence, and big data analytics creates a potential for huge advances in productivity, efficiency, and cost savings. The IIoT creates a universe of sensors that enables an accelerated deep learning of existing operations. These data tools allow for rapid contextualization, automatic pattern, and trend detection. Furthering this for manufacturing operations will finally allow for true quantitative capture of formerly “expert” qualitative operations.
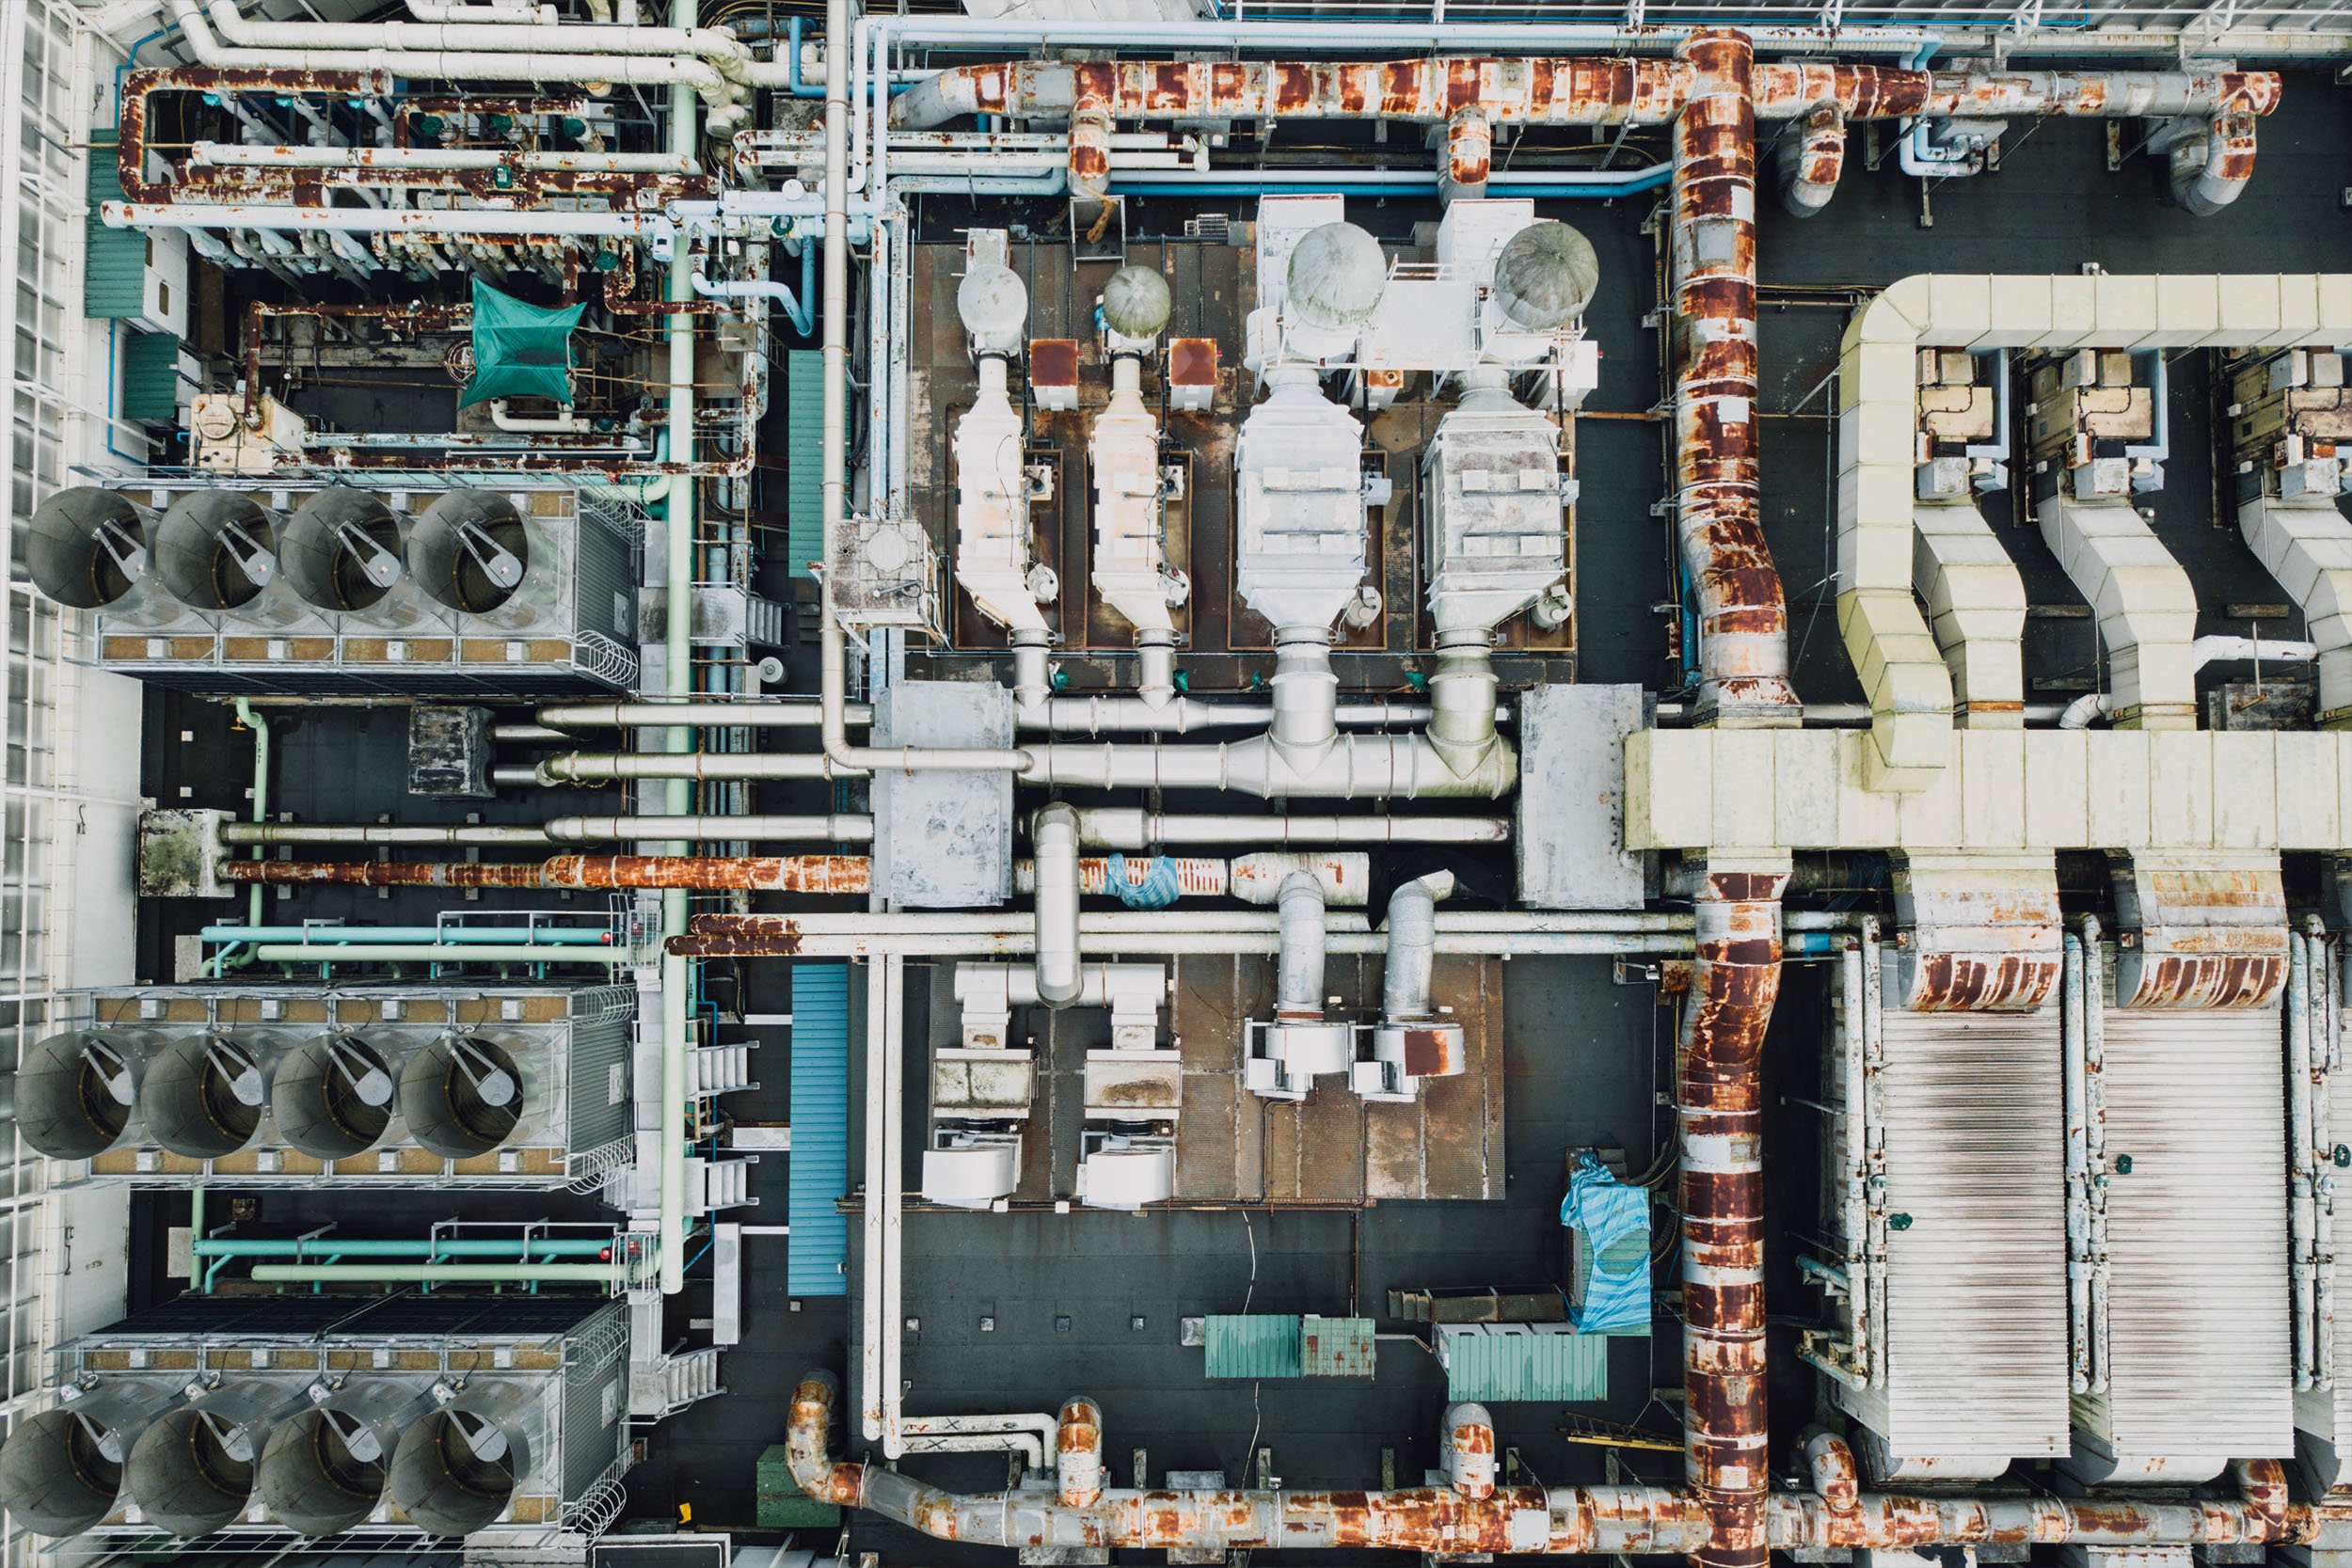
Pictured above: Production in both discrete and process manufacturing industries rely on throughput and is a complex orchestration of command and control systems for production as well as bolt-on wireless sensing devices on brownfield equipment.
However, getting in the way of this digital future is legacy equipment, security concerns, OT vs. IT culture, and the “drowning in data yet starving for information” mode. Since 70% of industrial equipment is legacy equipment, it does not have all the latest sensing or digital product features. Current productionized machine learning solutions also often lack real domain or subject matter experts, data (industrial equipment can last 10-20 years so anomaly detection is very infrequent) in order to find an optimal and generalizable model(s), and integration into automated workflows. While data, information, and data science solutions are increasingly touted as the oil of the modern enterprise, it is often poorly designed, poorly understood, and poorly utilized in daily activities. In this case, technology advances are surpassing our ability to acclimate.
Where to Begin
When we look to big data to detect complex patterns for entire plant or batch processes, we often start by adding sensors to measure machine health to older equipment. This allows us to add intelligence to a variety of critical equipment in order to minimize asset downtime, maximize productivity, and ensure workplace safety.
Rotating equipment such as pumps, fans, and motors are in every plant environment and is a major share of the condition monitoring asset class. They often have problems such as lubrication, cavitation, looseness, imbalance, as well as bearing issues. In this specific area, we monitor vibration and ultrasonic energy through an accelerometer, which is deemed the critical measurement to sense problems in rotating equipment. When a problem occurs on this equipment, a maintenance professional generates a work order and it is queued up to be serviced. Typically, it is run to failure or a vibration analyst is brought in to collect hundreds of thousands of vibration data points, calculate the Fast Fourier Transform for a spectrum view of the data, analyze the spectrum, and compare the spectrum to historical data.
The question then becomes whether or not we can leverage that analysis on a continual basis to have continuous machine health monitoring and preempt catastrophic failure. This is what is known in IIoT as predictive analytics. We want alerts on minor, escalating, and high-priority items. However, vibration is such an animal that it does not fail linearly. There is a “hockey stick” moment that has been collected in millions of cases and thoroughly understood. Even though the hockey stick failure is rather unpredictable, we can create a predictive band to better answer the question “When will it fail?” Having a timeframe in mind, the operation can proactively plan and schedule for maintenance and try to manage within a planned and scheduled downtime for maintenance and know how hard it can push these assets.
Condition Monitoring
In common practice, continuous vibration monitoring on industrial equipment is collected in the 2-1,000Hz frequency range and is trended, reported, and alerted in inches per second (IPS). This measurement provides a good indication of imbalance, misalignment, and/or looseness. Alert setting guidelines for this measurement can be found in ISO 10816.Additionally, this 2-1,000 Hz (low frequency) vibration is successfully used for equipment shutdown and personnel safety. This measurement is referred to as overall vibration and is helpful for late stage identification of failures. However, by itself, it is not a good “early warning” or “predictive analytics” on the future health of the machine.
Pictured above: The blue line or overall vibration indicates that there are some issues (imbalance, misalignment, looseness), but there is not enough granularityto pick up the bearing faults to enable 30 days or more of advanced warning to allow the plant to schedule appropriately.Conversely, the high-frequency ultrasonic line in green enables visibility to see machine health issues 30, 60 or 90 days in advance.
It is in the 1,000–30,000 Hz frequencies, including ultrasonic frequencies, where the future or predictive data of machinery health is detected. In the past, this has been largely a manual process, completed on a monthly data collection and analysis by an experienced vibration analyst. However, new, cheaper, and faster processing of sensor data has enabled continuous ultrasonic monitoring for predictive maintenance. In this case, the same accelerometer used above is now sampled at very high frequencies (a 100mV/G piezo accelerometer is common).This measurement is trended, reported, and alerted in G’s (Acceleration) and provides a good early warning of lubrication fault, early bearing fault, cavitation, and/or friction faults.
Alert setting for this measurement does not have an industry standard, however some vendors like AssetScan publish alert setting guidelines. This measurement is referred to as Peak Fault or Bearing Fault monitoring and/or casually as ultrasonic monitoring. Although the measurement comes from the same sensor, this second sampling rate and calculation creates a measurement that is separate and mutually exclusive from the Overall Vibration measurement commonly found in industry today. The Peak Fault algorithm captures peak data in contrast to other techniques that use root mean square (RMS). By doing so, it has good separation from the noise floor, which is often an issue on slow rotating machinery.
Additionally, the Peak Fault algorithm has alert guidelines that do not require baselining to set alerts. Easy alert setting enables asset-to-asset comparison over a wide class of assets and eliminates confusion on how bad is bad, or how good is good. For example, the alert limits for machines running between 600 – 6,000 RPM (the majority of industrial equipment) are 6, 12, and 18 G’s for Minor, Warning and Critical alerts. This breakthrough enables data labeling that is critical to machine learning, as well as beneficial to operations and maintenance teams to create prescriptive tasks or work orders.
Predictive Analytics
With machine learning, we want to extend our subject matter expertise to illustrate the predictive band even further. Polynomial regression fits a nonlinear relationship between the value of x and the corresponding conditional mean, and has been used to describe nonlinear phenomena such as the fault rate of bearings where x is time and y is ultrasonic vibration measured in G’s. This type of regression is used for the upper limit of the confidence band and matched best with our data and domain expertise mapping back to the hockey stick or nonlinear failure and conservative approach to ensure no underestimation or underfit model. The lower limit of the confidence band was estimated using simple linear regression.
Pictured above: Polynomial regression as upper predictive band is utilized to fit nonlinear data and linear regression is employed for lower confidence band.
Providing more feedback over time will improve the model, considering particular industrial machines in particular environments with more data. This will give plants and manufacturers more time to react to potential machine failures resulting in reduced unplanned downtime, more productivity, more cost savings on equipment, and improved worker safety.
About the Authors
Dan Yarmoluk is the business and market development lead for ATEK’s IoT products which include TankScan and AssetScan.Dan has been involved in analytics, embedded design, and components of mobile products for over a decade with a focus on creating and driving IIoT automation, condition monitoring, and predictive maintenance programs with technology with how analytics and business models intersect to drive added value and digital transformation. Industries served include: oil and gas, refining, chemical, precision agriculture, food, pulp and paper, mining, transportation, filtration, field services and distribution. He publishes his thoughts frequently and has a popular “All Things Data” Dr. Manjeet Rege, all of which can be found at www.vertiai.com.He has an MBA and a Master’s of Data Science.
Craig Truempi is a Certified Maintenance and Reliability Professional (CMRP), board member of the Upper Midwest Chapter of the Vibration Institute, and Director of IIoT Reliability Solutions. Craig has been involved in a diverse range of industrial reliability projects in the power, refining, mining, petrochemical, manufacturing, and food industries.He has managed replacements and upgrades of GE Bently, Bruel & Kjaer, and Emerson/CSI vibration monitoring equipment. Most recently, Craig led the development and justification of a digital ecosystem for online condition monitoring using wireless technologies from ATEK Technologies, as well as, supported the re-design of related maintenance work flow.Craig received his B.S. in Electrical and Electronic Engineering from North Dakota State University and a M.B.A. from the University of Minnesota.
Source
https://www.datascience.com/blog/predictive-analytics-in-industrial-iot
Stay connected